In this post, we will look at the different races of people who have fled or not fled in different scenarios.
Based on the database, the races included in the data are
White, Black, Asian, Hispanic, Native American, and Other
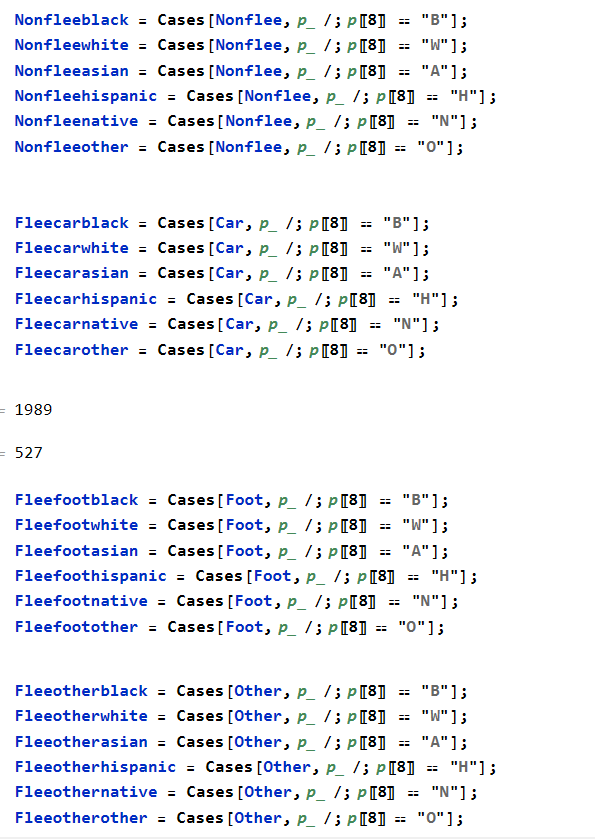
We first start by making new variables to store the amount of occurrences of a race in different fleeing/non-fleeing scenarios.

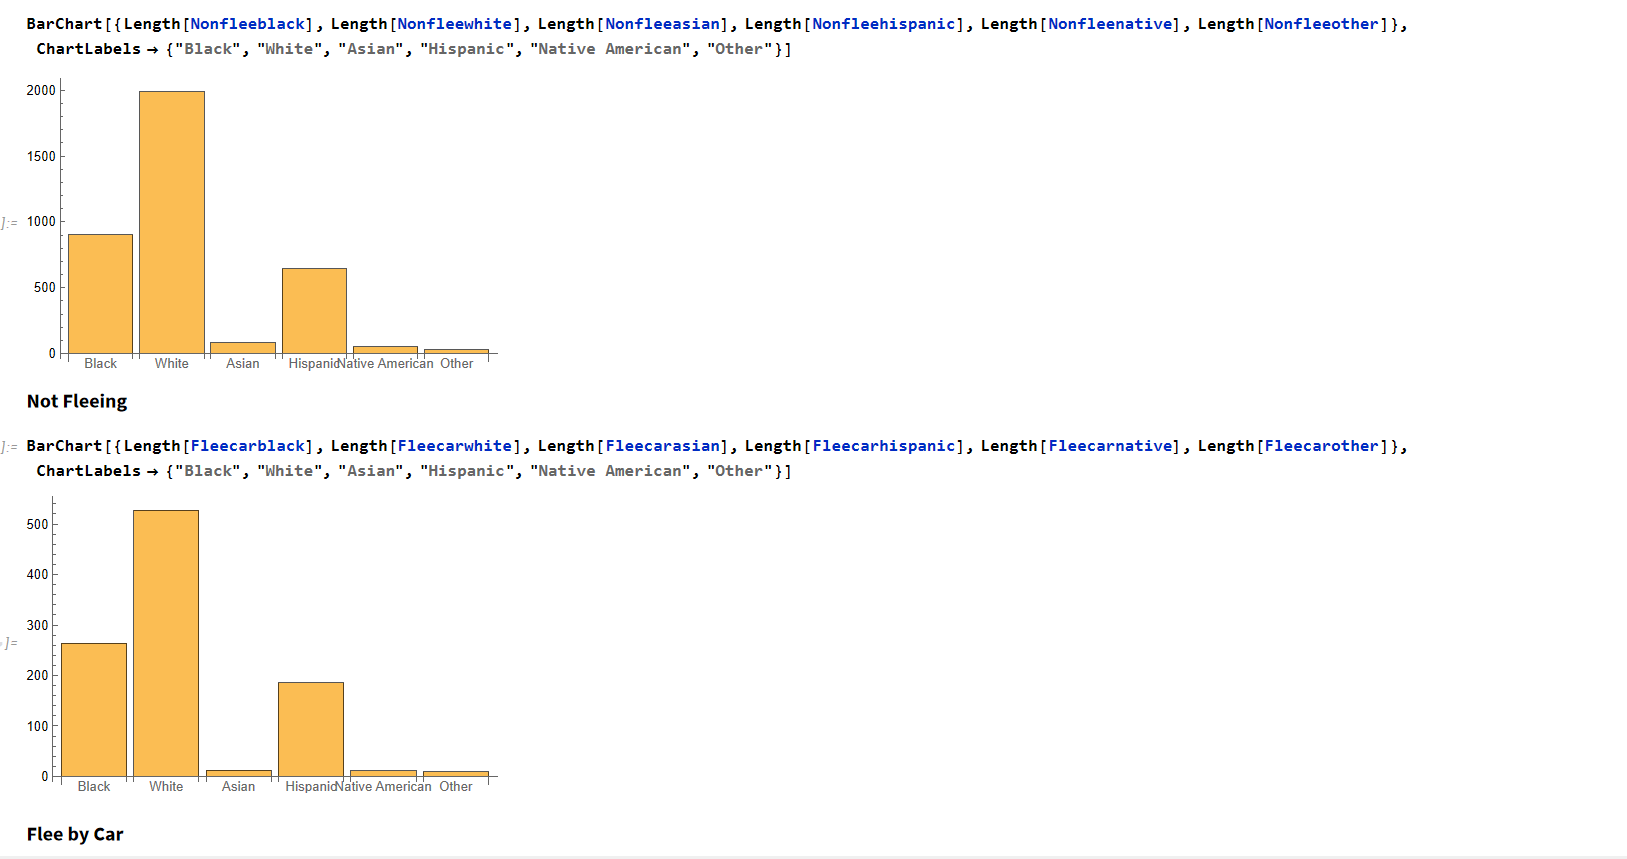
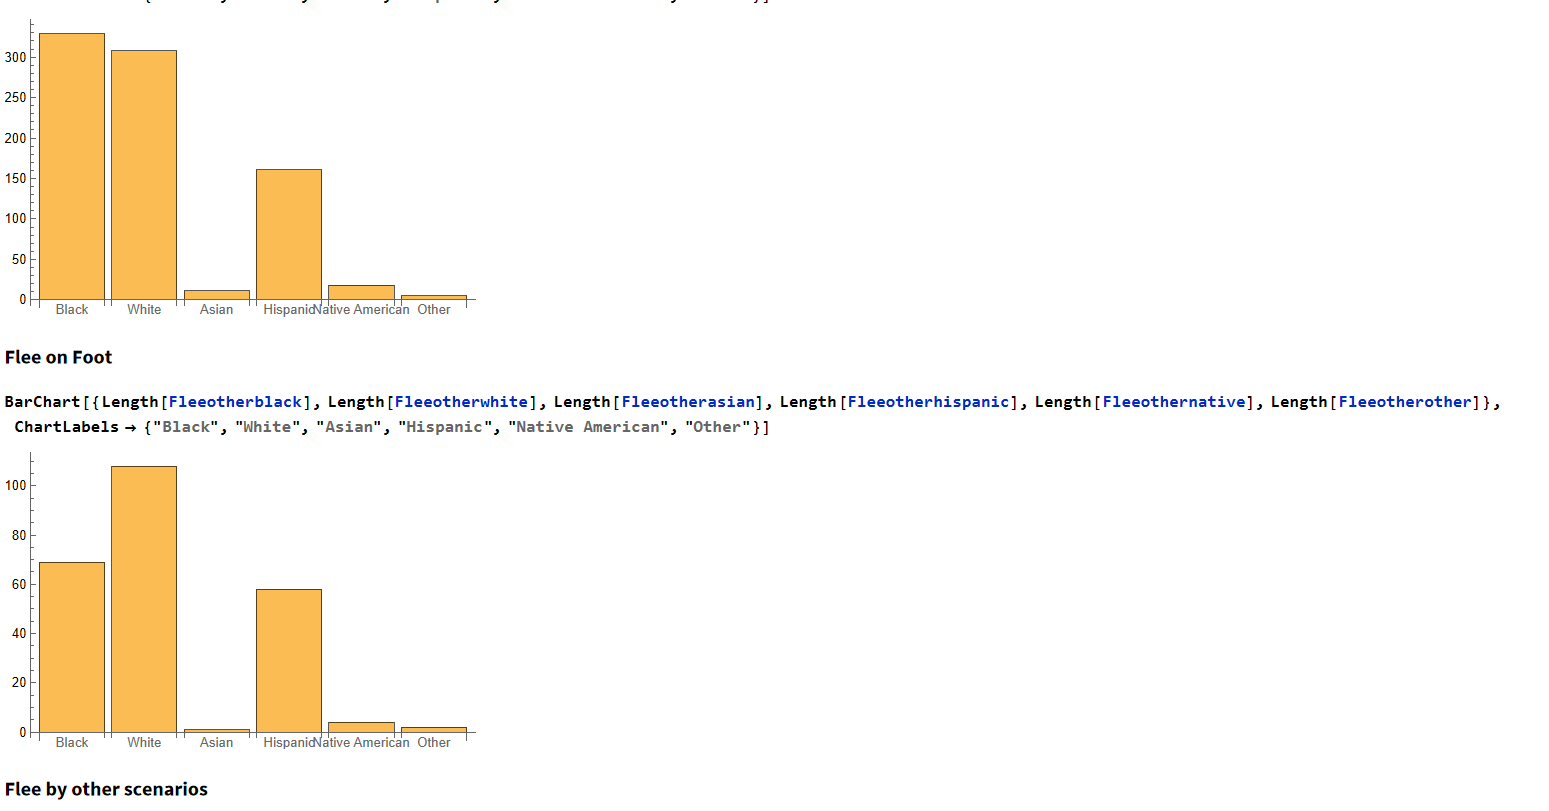
We can then plot four seperate bar charts to show the amount of individuals from a race that is more prominent in non-fleeing or fleeing.


From these graphs, we can see the majority of individuals are amongst the white race but on foot, the black race is more prominent.
After seeing these graphs, I wanted to know what the individual percentages of these races that flee compared to their whole population to see if there is a dramatic change.
Every race had shown to have 53% or greater when non-fleeing and other categories of fleeing all distributed for the other 47% or less
