
Continuing from the previous post of looking into total people of non-fleeing / fleeing cases, I decided to journey deeper to see what the age groups of people that fall into these categories.
In order to compute this, we need to isolate the ages from each case and plot it with a histogram function to see the majority of ages that perform either non-fleeing actions or different fleeing actions.
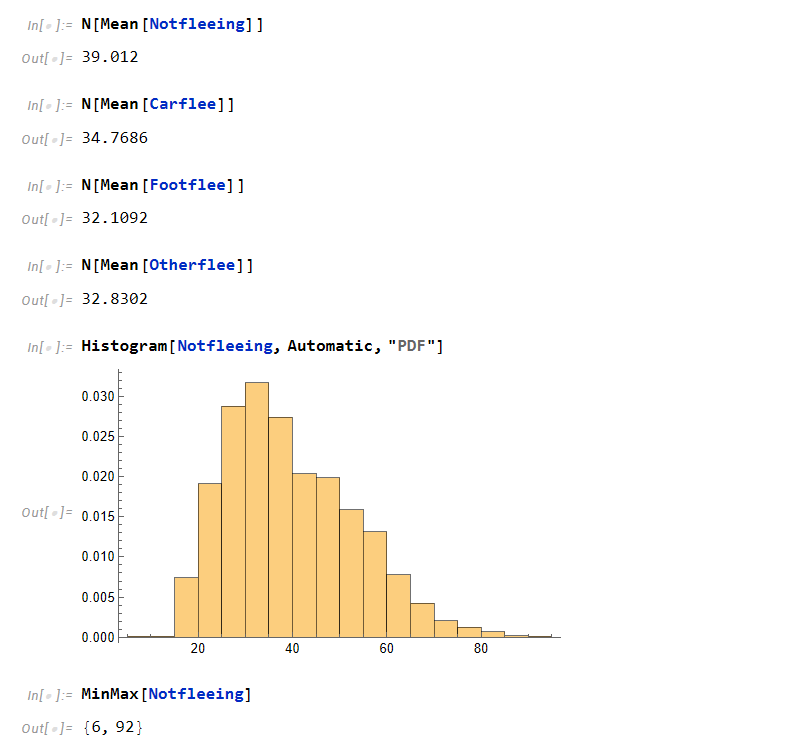
For non-fleeing cases, we can see the median is of age 39 and it peaks around the ages of 28-39. Also, the lowest and highest ages are 6 and 92.
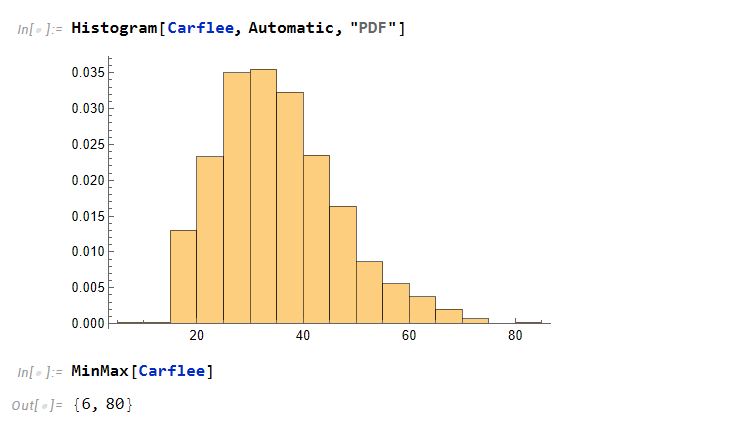
For car fleeing cases, the median of ages is about 34 and the peaks are similar from about 28 – 39. It also is similar in lowest and highest ages of 6 and 80.
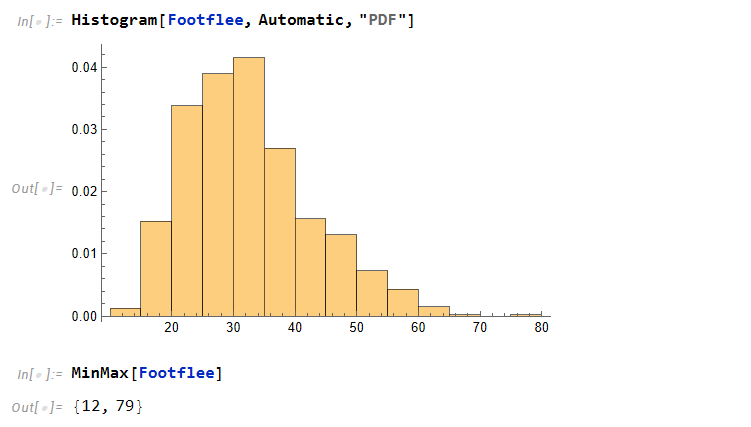
For foot fleeing cases, we can see the peaks are closer but the ages are younger than the previous categories. Also we notice that the highest age limit is the lowest of all of them.
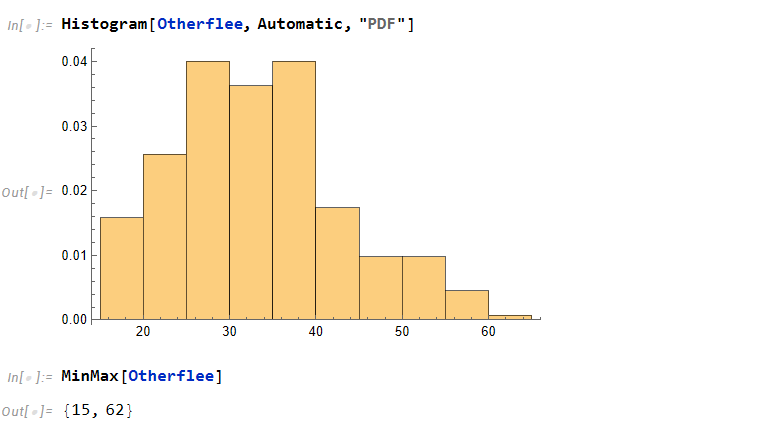
Finally, for other scenarios, the histogram is more uniform than the previous histograms and show peaks at 25 – 39.
Overall, the majority of people fleeing are around 25-39.