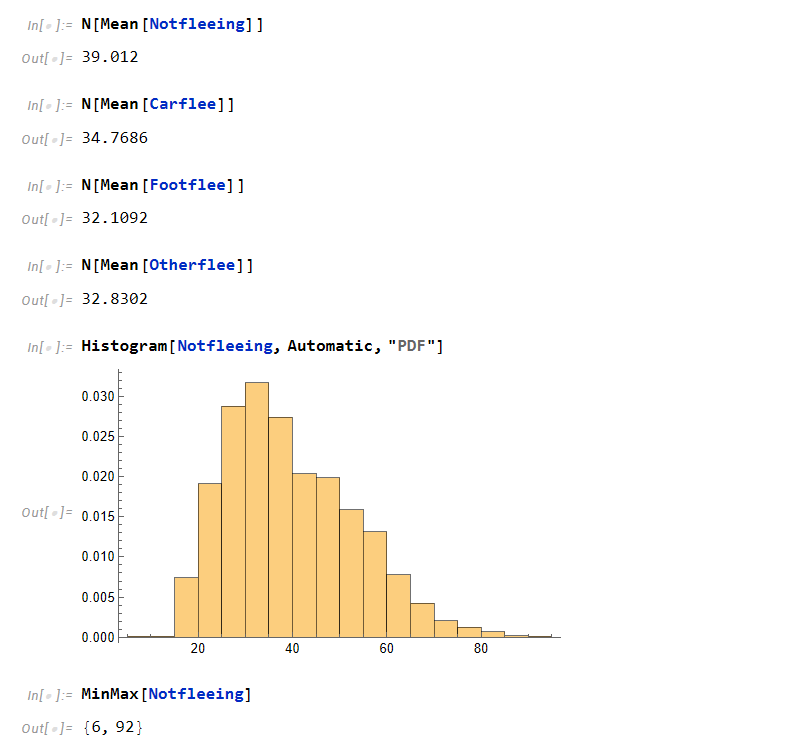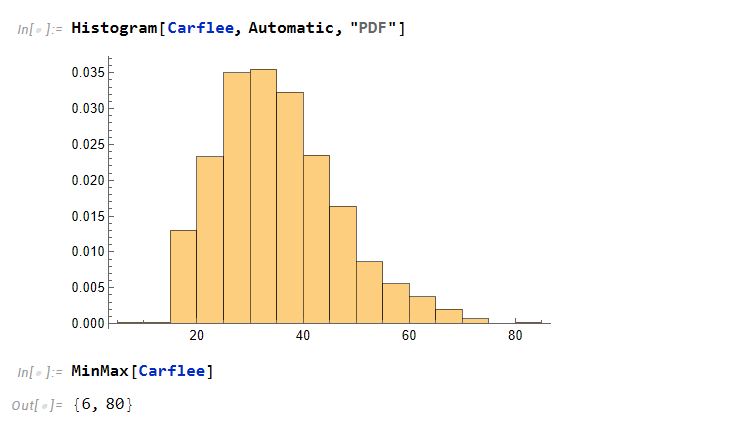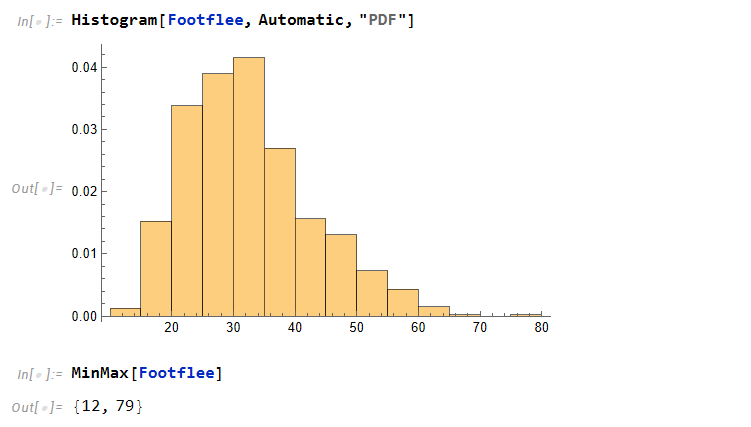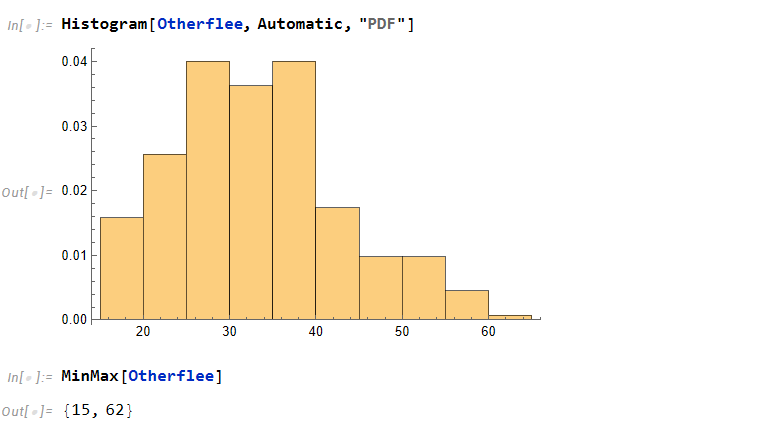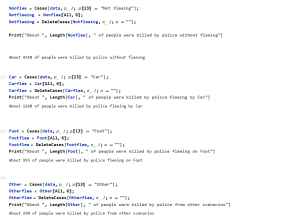
From a previous post, we had saw that the mean of individuals who don’t flee is around the age of 39 while people who do flee in the three categories (by car, by foot, or other) is around 33 years of age. This is a dramatic difference of about 6 years.
However, it would be interesting to see if this behavior is the same for each race. In order to see the mean of each race, we need to seperate the data to include the ages of a race that don’t flee and take the mean of it and take the ages of a race that flee in all three categories and take the mean of that and then we can compare the data.
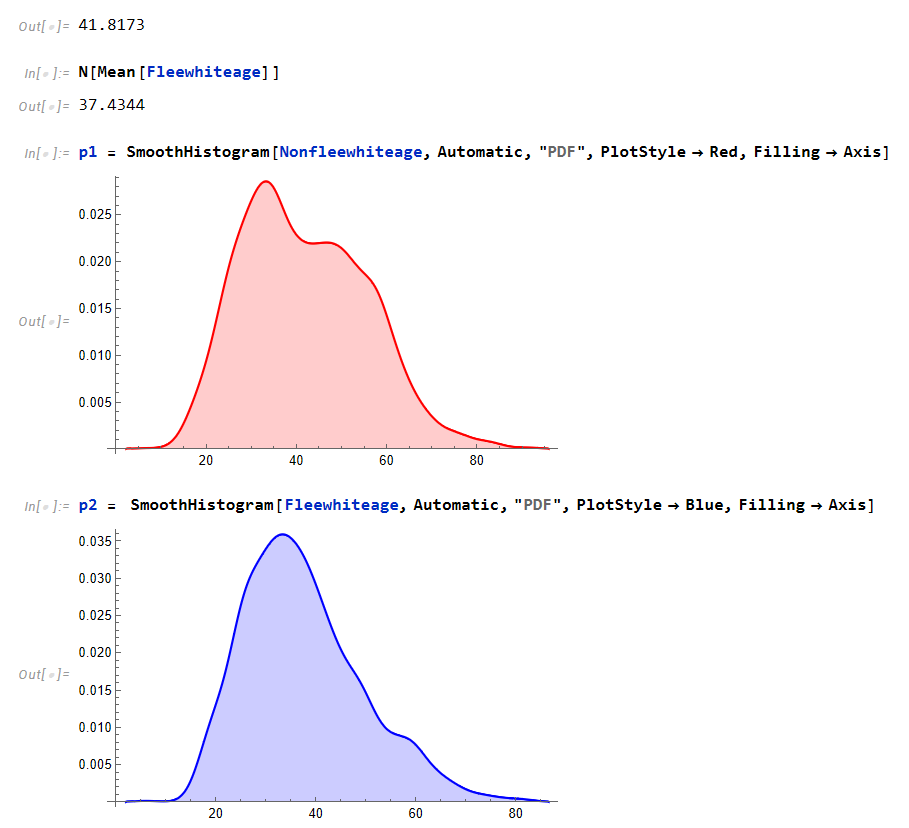
We can see that the mean age of white individuals who don’t flee are 41 almost 42 while fleeing is 37 which indicates similar behavior.
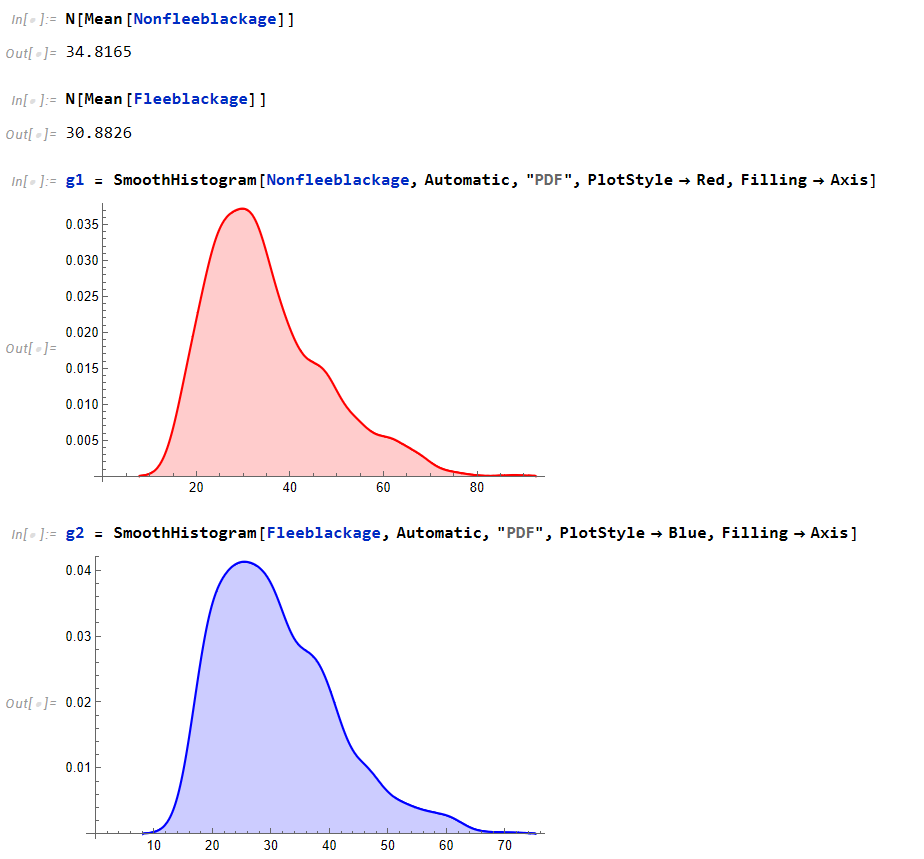
For the black race, the mean of individuals who don’t flee is 34 almost 35 while fleeing is 30 almost 31. Again, similar behavior.
We repeat this for Asian, Native American, and Hispanic population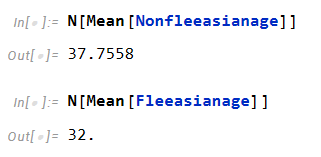
(Asian Means)
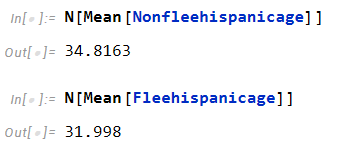
(Hispanic Means)
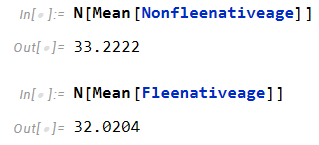
(Native American Means)
We can see that every population follows this pattern of older people tend to be killed more by not fleeing while younger individuals are killed more by fleeing.