Races of Non-Fleeing/Fleeing Individuals

In this post, we will look at the different races of people who have fled or not fled in different scenarios.

Based on the database, the races included in the data are

White, Black, Asian, Hispanic, Native American, and Other

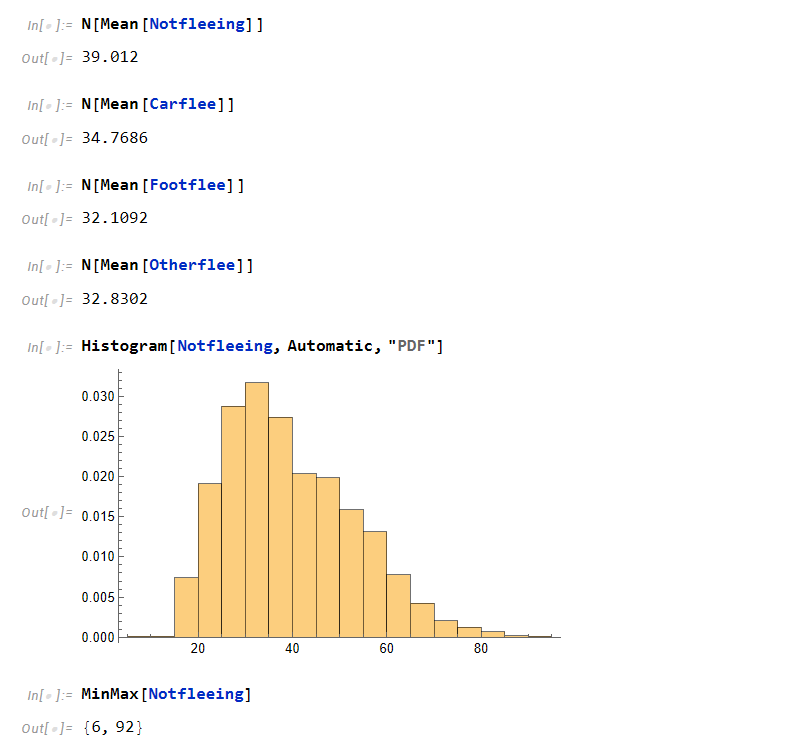
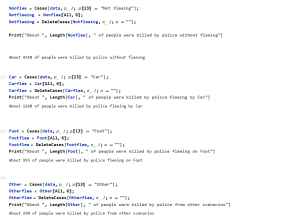
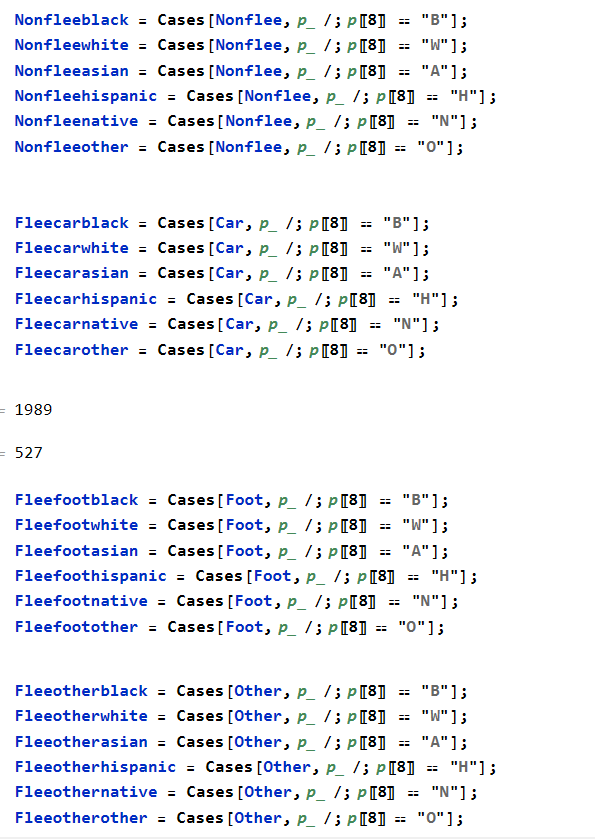
We first start by making new variables to store the amount of occurrences of a race in different fleeing/non-fleeing scenarios.

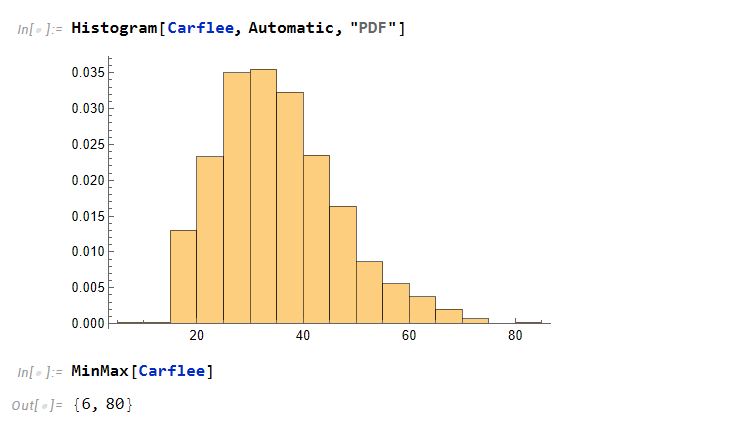
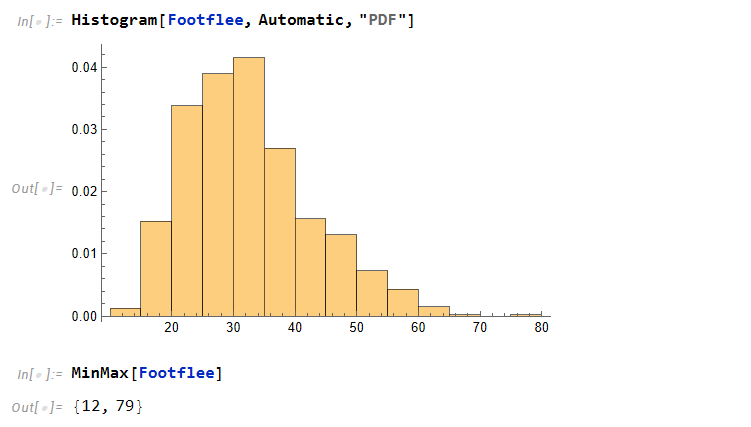
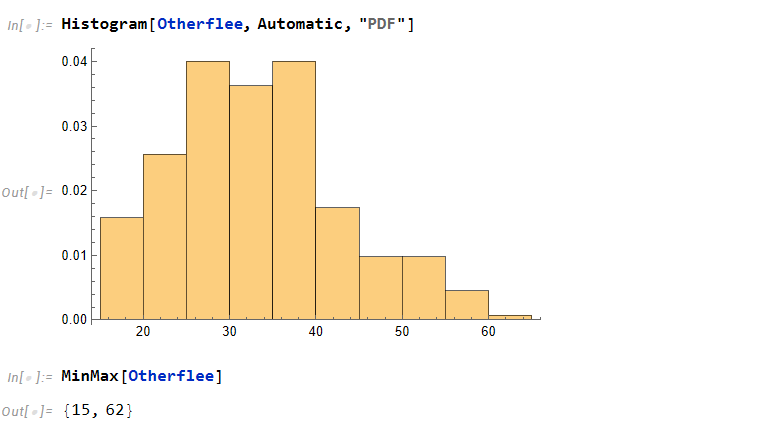
We can then plot four seperate bar charts to show the amount of individuals from a race that is more prominent in non-fleeing or fleeing.

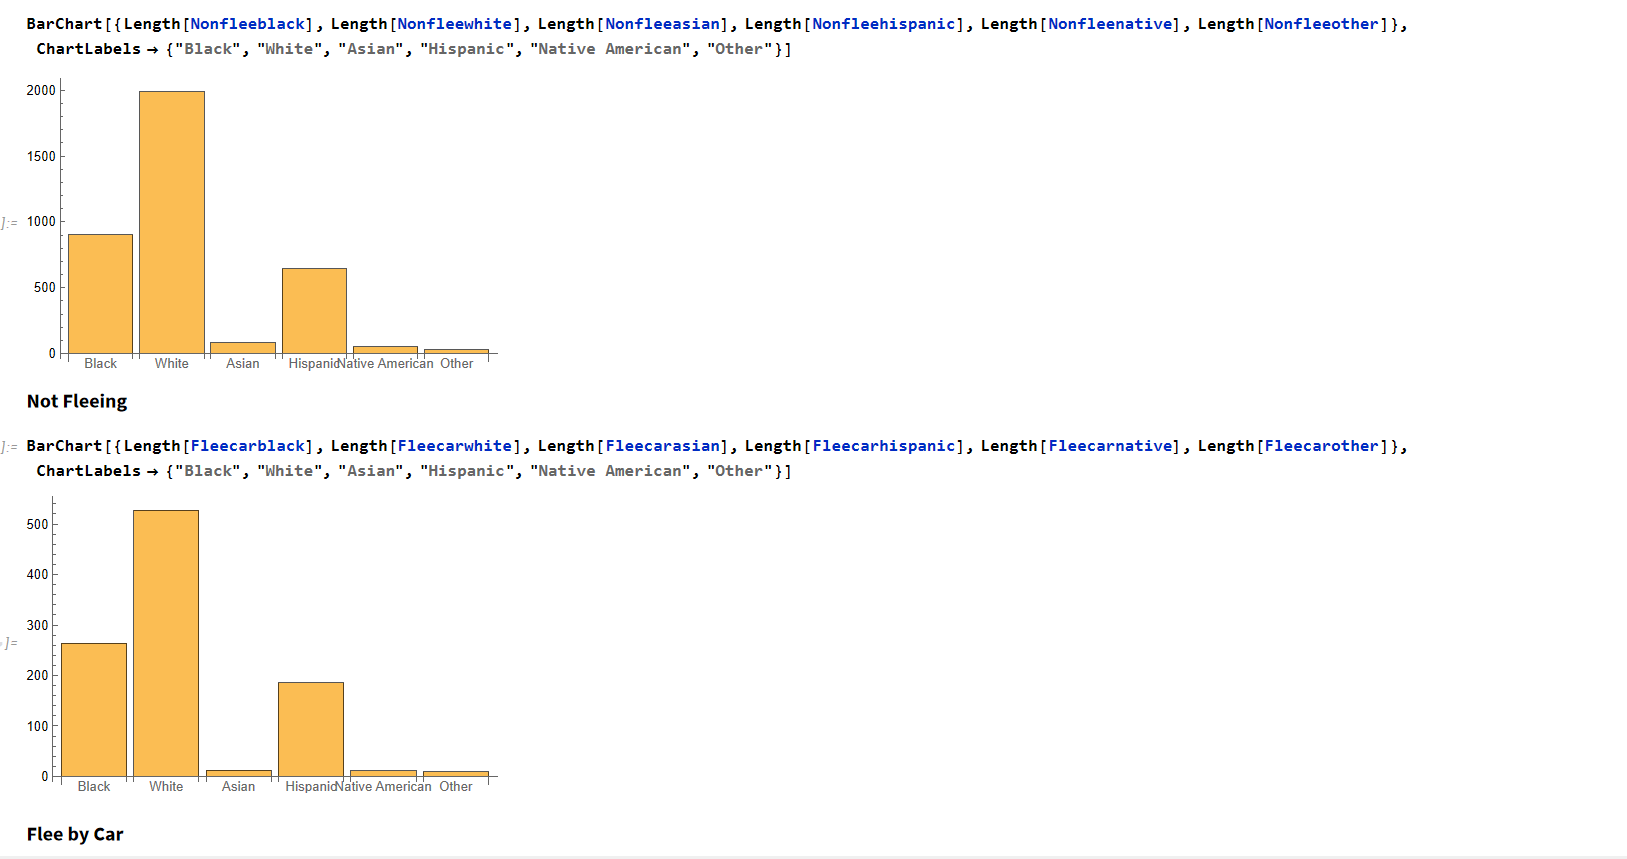
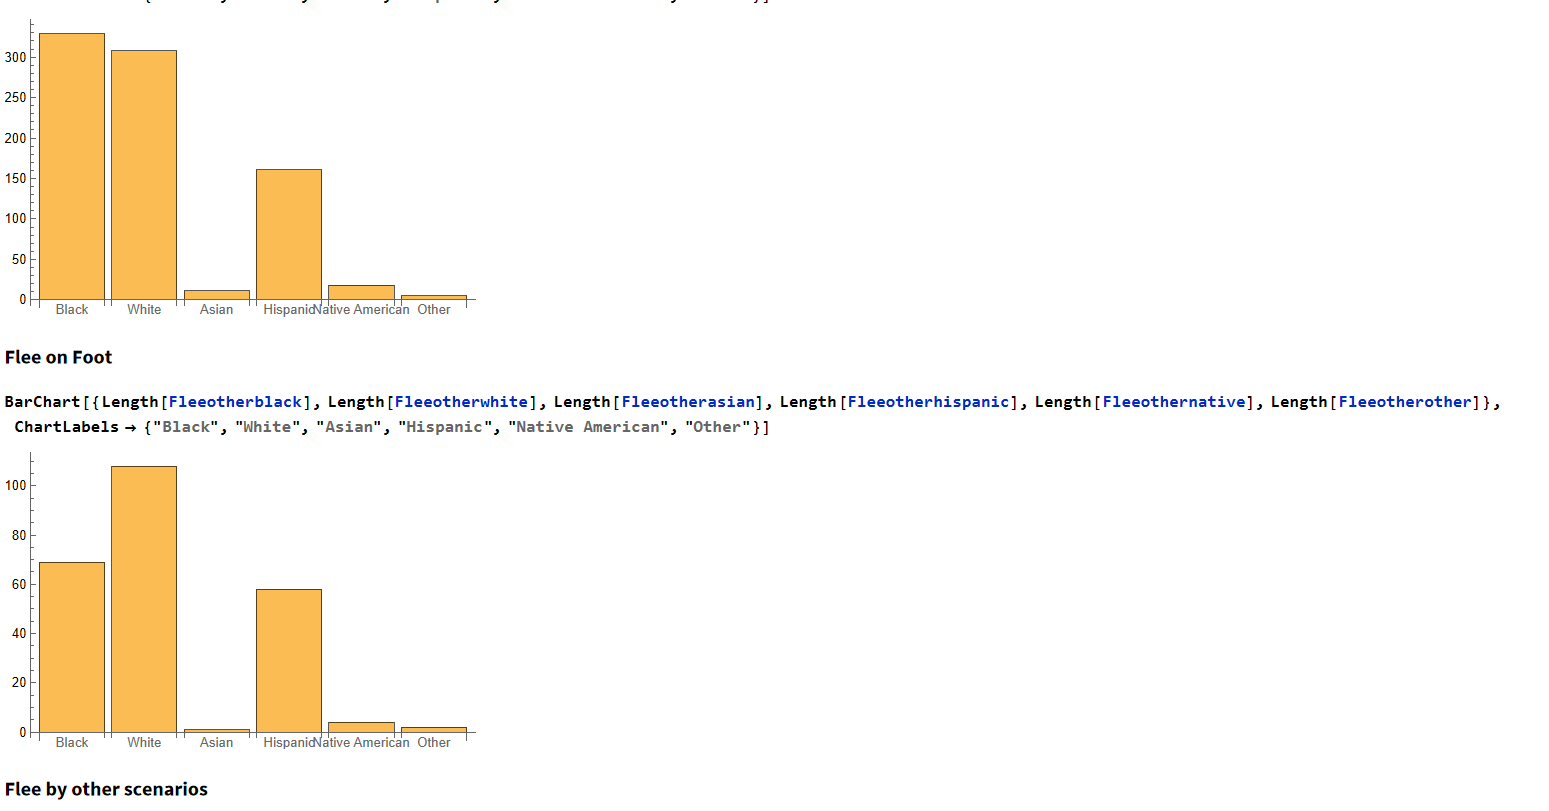
From these graphs, we can see the majority of individuals are amongst the white race but on foot, the black race is more prominent.

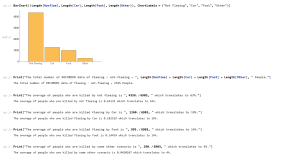
After seeing these graphs, I wanted to know what the individual percentages of these races that flee compared to their whole population to see if there is a dramatic change.

Every race had shown to have 53% or greater when non-fleeing and other categories of fleeing all distributed for the other 47% or less

Ages of Non-Flee / Fleeing Cases

Continuing from the previous post of looking into total people of non-fleeing / fleeing cases, I decided to journey deeper to see what the age groups of people that fall into these categories.

In order to compute this, we need to isolate the ages from each case and plot it with a histogram function to see the majority of ages that perform either non-fleeing actions or different fleeing actions.

For non-fleeing cases, we can see the median is of age 39 and it peaks around the ages of 28-39. Also, the lowest and highest ages are 6 and 92.

For car fleeing cases, the median of ages is about 34 and the peaks are similar from about 28 – 39. It also is similar in lowest and highest ages of 6 and 80.

For foot fleeing cases, we can see the peaks are closer but the ages are younger than the previous categories. Also we notice that the highest age limit is the lowest of all of them.

Finally, for other scenarios, the histogram is more uniform than the previous histograms and show peaks at 25 – 39.


Overall, the majority of people fleeing are around 25-39.

Total People in Non-Flee / Fleeing Cases

Looking into the police shootings database, I decided to look into correlation of police shootings to individuals who don’t flee or do flee (either by car, foot or other scenarios).

I decided to check the percentage of the total amount of reported shootings to see how many people flee or don’t flee.

From the database, we have an overall population size of 7803 people reported being shot by police and 4358 of the people are shot by not fleeing.

These can be represented by a bar graph and we can determine the percentage of people in these categories:

We can see that 63% of the population are killed by not fleeing, 18% by car, 14% by foot and 4% by other scenarios.

For next week, we will determine the average age of people who flee in these categories and plot histograms of each one.